> ## Documentation Index
> Fetch the complete documentation index at: https://shapely.mintlify.site/llms.txt
> Use this file to discover all available pages before exploring further.
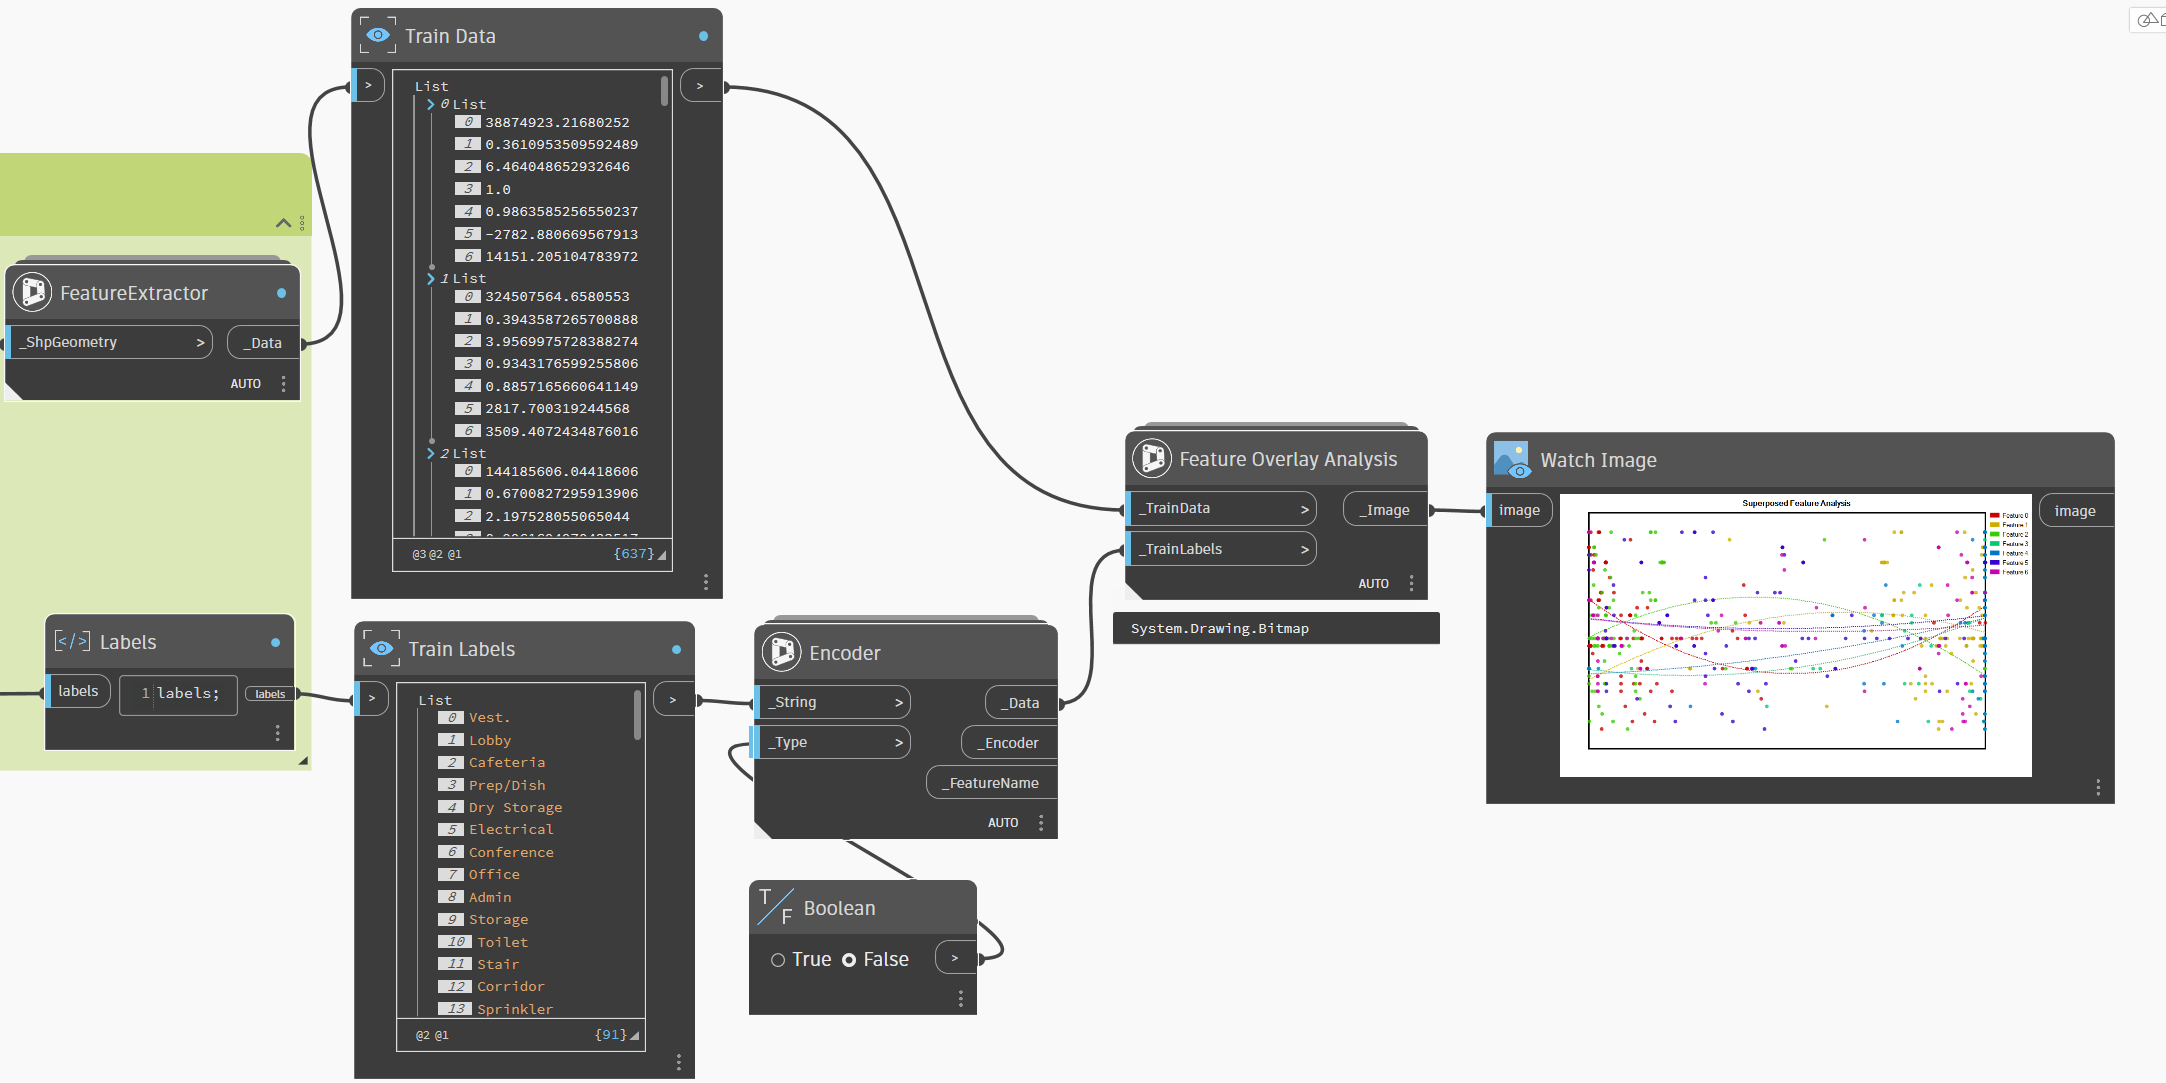
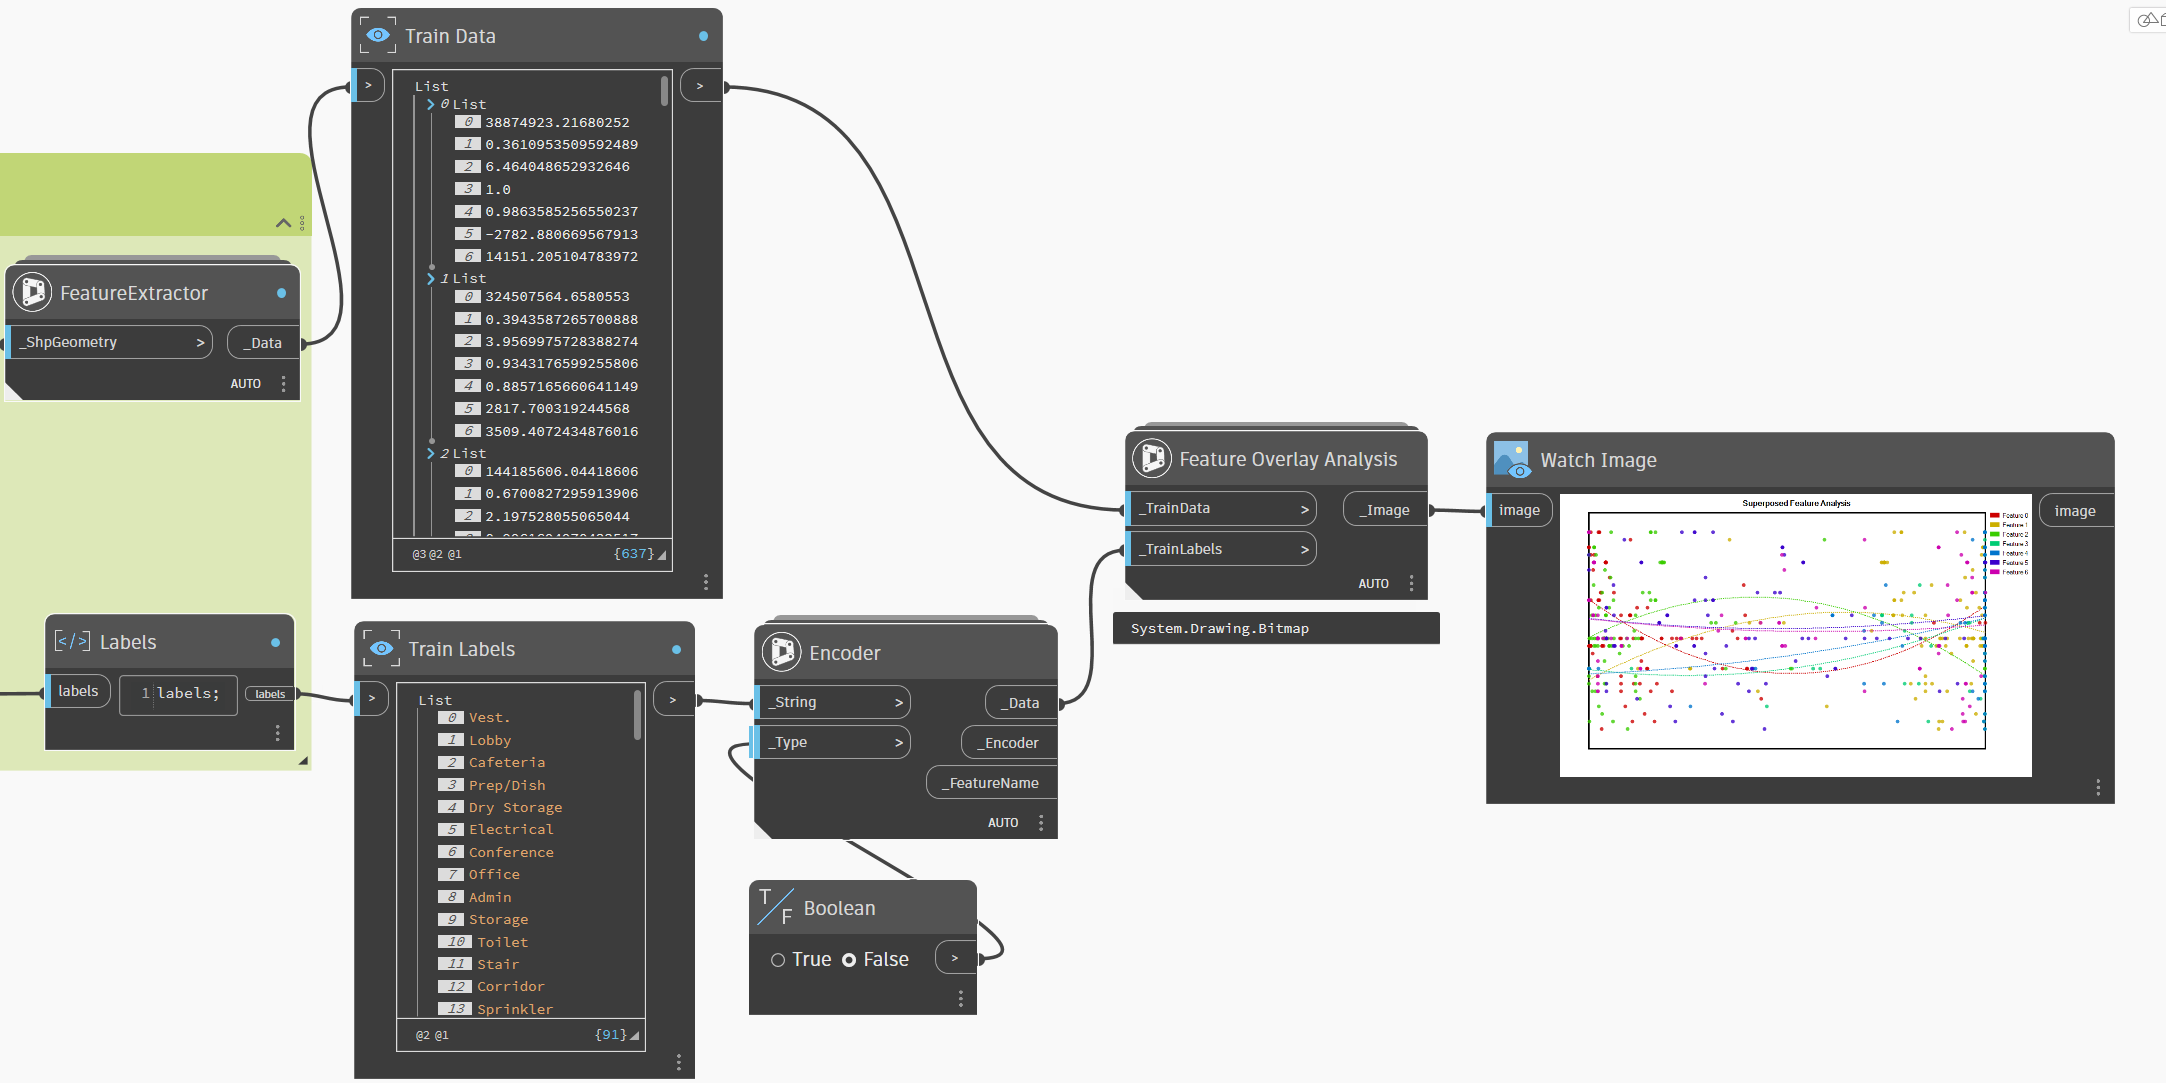
# Feature Overlay Analysis
> Feature Overlay Analysis visualizes and compares the distribution of features across different clusters or classes. It helps you understand how each feature contributes to the separation between groups.
This analysis reveals which features are most distinctive for each cluster or class.
Use Feature Overlay Analysis **after** clustering or classification to understand your results. It is especially useful for identifying which geometric properties (area, perimeter, compactness) differ most between groups.
### Use Cases
* **Cluster interpretation**: Understand what makes each cluster unique by comparing feature distributions across groups.
* **Feature relevance**: Identify which geometric properties are most useful for distinguishing between categories.
* **Result validation**: Verify that clusters represent meaningful differences in the data, not random noise.